


Last updated: October 11, 2026 · US data as of the August 2026 CPI and the SF Fed series updated September 30, 2026
Demand-pull inflation happens when total spending grows faster than the economy can produce, so prices rise while output and jobs grow. Cost-push inflation happens when production costs jump, for example oil, energy or imported inputs, so prices rise while output stalls or falls. The difference matters because interest rate hikes cool demand-pull inflation directly, but against cost-push inflation they mainly prevent a wage-price spiral, at the cost of slower growth. Real episodes are usually a mix: by the San Francisco Fed’s measure, supply factors explained about half of US inflation at its 2022 peak.
Textbooks present demand-pull and cost-push inflation as two neat boxes. The data rarely do. The 2021–2023 inflation surge is still argued about by Federal Reserve economists, and the answer to “which type was it?” shaped how fast rates went up and how deep the slowdown risk was. This guide explains both types, draws them on an AD-AS diagram, walks through the evidence from the 1970s and the 2020s, and shows how you can check which type is driving inflation right now using public data.
What is the difference between demand-pull and cost-push inflation?
Demand-pull inflation starts on the spending side and raises prices together with output; cost-push inflation starts on the cost side and raises prices while output falls. That one difference drives everything else, including how a central bank should respond.
| Demand-pull inflation | Cost-push inflation | |
|---|---|---|
| Starts with | Spending that outruns productive capacity | Higher costs of producing goods and services |
| Output (real GDP) | Rises | Falls or stalls |
| Unemployment | Falls | Tends to rise |
| AD-AS diagram | Aggregate demand (AD) shifts right | Short-run aggregate supply (SRAS) shifts left |
| Typical triggers | Cheap credit, fiscal stimulus, strong wage growth, export or asset booms | Oil and energy shocks, supply-chain disruptions, weaker currency, tariffs, wages outpacing productivity |
| What you see in the data | Broad price increases, rising core inflation, strong jobs and credit | Energy and food spike first, headline inflation well above core |
| Rate hikes | Work at the source | Cannot lower oil prices; mainly guard against second-round effects |
| Classic example | Late-1960s US: war spending plus loose policy | 1973 and 1979 oil shocks |
What is demand-pull inflation and what causes it?
Demand-pull inflation is a rise in the price level caused by aggregate demand, meaning household, business, government and foreign spending, exceeding what the economy can supply at current prices. The IMF’s Finance & Development primer describes it as demand rising faster than production capacity. Firms near full capacity cannot hire or build fast enough, so they raise prices instead of output.
Common causes:
- Loose monetary policy: low interest rates make borrowing for homes, cars and investment cheap.
- Fiscal stimulus: tax cuts or transfers financed by borrowing add spending without adding supply.
- Strong wage and job growth that lifts purchasing power faster than productivity.
- Wealth effects from rising stock or house prices.
- Money supply growth: in the monetarist view, sustained inflation is “too much money chasing too few goods”, and demand-pull is how excess money shows up in prices.
The signature is that prices, output and employment rise together; the economy “overheats”. On a single market the same logic is a demand curve shifting right against a fixed supply curve, which we cover in market equilibrium explained.
What is cost-push inflation and what causes it?
Cost-push inflation is a rise in the price level caused by higher production costs that firms pass on to buyers. Because it starts on the supply side, it is also called supply-shock or supply-side inflation. Firms are willing to produce less at every price, so prices rise and output falls at the same time.
Common causes:
- Energy and commodity shocks: oil, gas and electricity feed into transport, manufacturing, fertiliser and food.
- Supply-chain disruptions: shortages of chips, shipping capacity or key inputs.
- A weaker currency, which raises the price of everything imported.
- Tariffs and taxes: a tariff is a cost added at the border, and some of it is usually passed through to consumer prices.
- Wages rising faster than productivity, which raises unit labour costs.
- Natural disasters and harvest failures, which hit food prices.
Cost-push inflation hurts more than demand-pull inflation because households lose twice: prices rise while job and income growth slow. Necessities such as food, heating and fuel are usually hit first, and they take a larger share of lower-income budgets.
How do demand-pull and cost-push inflation look on an AD-AS diagram?
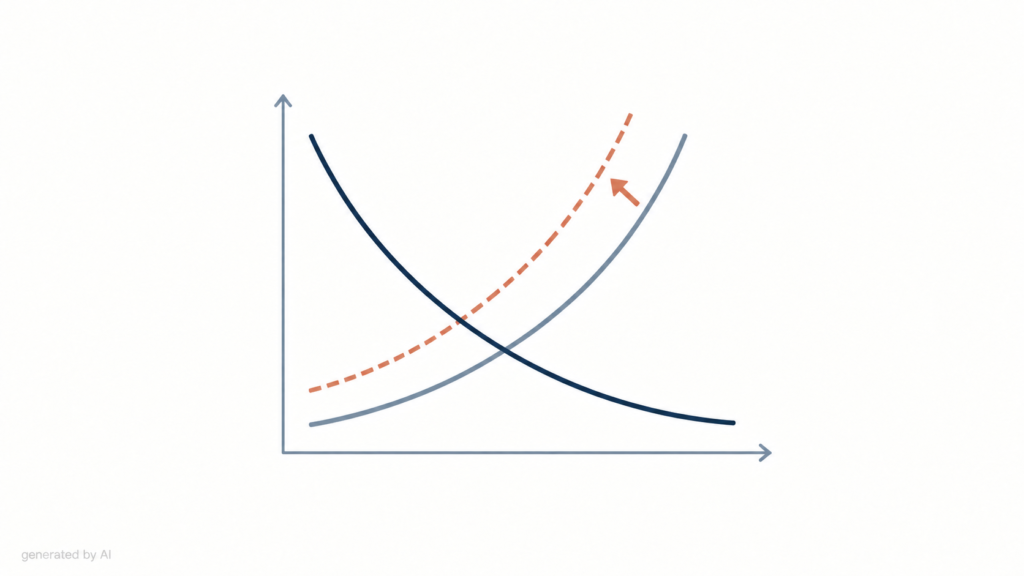
Demand-pull inflation is a rightward shift of aggregate demand (AD); cost-push inflation is a leftward shift of short-run aggregate supply (SRAS). Both move the equilibrium to a higher price level, but output moves in opposite directions.
The bottom panel is the central banker’s dilemma in one picture. Raising rates shifts AD back to the left: inflation slows, but output falls even further. Doing nothing risks inflation becoming embedded in wages and expectations. That is why the policy response to a supply shock is always a judgement call rather than a formula.
What are real-world examples of cost-push inflation?
The textbook examples are the oil shocks of the 1970s. According to the Federal Reserve’s own history of the period, crude oil prices quadrupled during the 1973–74 Arab oil embargo, and the 1979 shock after the Iranian revolution tripled the cost of oil again; oil prices more than doubled between April 1979 and April 1980. US consumer price inflation peaked at 14.8% year over year in March 1980, according to BLS data.
Those episodes also produced stagflation: high inflation together with weak growth and rising unemployment, the pattern the bottom panel of the diagram predicts. Ending it took the Volcker Fed’s very high interest rates and two recessions in the early 1980s, which is why economists treat a supply shock that leaks into wage-setting as the most expensive kind of inflation to fix.
Other cost-push cases include the 2022 European energy crisis after Russia’s invasion of Ukraine, harvest-driven food price spikes, and currency collapses in import-dependent economies. Our Polish article on inflacja popytowa i kosztowa breaks down Poland’s 2023 peak of 18.4%, where food, energy and transport alone contributed more than 13 percentage points.
What are real-world examples of demand-pull inflation?
Classic demand-pull episodes come from spending booms that outrun capacity. In the US, the late 1960s combined Vietnam War spending and Great Society programmes with accommodative monetary policy, and inflation rose steadily before any oil shock arrived; the Federal Reserve’s history dates the start of the Great Inflation to 1965. Housing and credit booms, post-war reopenings and large fiscal transfers into an economy already near full employment are other common triggers.
Demand-pull inflation is easier to stop because the cure targets the cause: higher rates and tighter fiscal policy reduce spending directly. The cost is usually a slowdown, but not the double hit of a supply shock.
Was the 2021–2023 inflation surge demand-pull or cost-push?
Both, and economists still disagree about the shares. Three pieces of evidence frame the debate:
- The SF Fed decomposition (Shapiro, 2022). Adam Hale Shapiro classified each PCE price category as supply-driven or demand-driven, depending on whether unexpected changes in its price and quantity moved in opposite or the same directions. In April 2022, headline PCE inflation was 6.3%, against a pre-pandemic (2010–2019) average of 1.5%. Supply factors explained 2.5 of the 4.8-point gap, “about half”, and demand factors about a third.
- Bernanke and Blanchard (2023). In their NBER paper, Ben Bernanke and Olivier Blanchard concluded that most of the surge that began in 2021 came from “shocks to prices given wages”: commodity price spikes and sectoral shortages. A tight labour market mattered less at first but had more persistent effects, so bringing inflation back to target required rebalancing labour demand and supply.
- Lansing (2025). A later SF Fed Economic Letter by Kevin Lansing, using a different model, concluded that demand was the primary driver of pandemic-era inflation, with supply a sizeable secondary factor.
Our reading: the trigger was largely cost-push (energy, shipping, chips, the shift of spending from services to goods), and strong demand, boosted by fiscal support and savings, decided how much of it firms could pass on and how long it lasted. The two-box textbook story misses that interaction, and it is the interaction that made the episode costly.
How do economists measure whether inflation is supply-driven or demand-driven?
The most widely cited public tool is the San Francisco Fed’s monthly “Supply- and Demand-Driven PCE Inflation” series. It splits year-over-year PCE inflation into supply-driven, demand-driven and ambiguous contributions using the price-and-quantity method above. The SF Fed still updates it; the latest release, dated September 30, 2026, covers August 2026.
| Headline PCE inflation, y/y | Supply-driven | Demand-driven | Ambiguous | Total |
|---|---|---|---|---|
| June 2022 (peak) | 3.43 pp | 2.76 pp | 0.95 pp | 7.14% |
| August 2026 (latest) | 1.03 pp | 1.21 pp | 1.19 pp | ≈3.4% |
| August 2026, core PCE | 1.07 pp | 1.17 pp | 0.76 pp | ≈3.0% |
Source: Federal Reserve Bank of San Francisco data files, downloaded October 2026; contributions in percentage points. Note that the series classifies price categories, not causes, so a supply shock that raises demand elsewhere can show up as demand-driven.
Two things stand out. At the 2022 peak, the supply-driven contribution alone (3.4 points) was larger than the Fed’s entire 2% target. In August 2026, no single source dominates: supply, demand and ambiguous categories each add roughly a point. That is a different picture from 2022, even though energy prices were again rising fast, up 16.3% year over year in the August 2026 CPI.
A quick checklist you can use
- Headline vs core. If headline CPI runs well above core (excluding food and energy), the impulse is mostly energy and food, which usually means cost-push. In August 2026, headline CPI was 3.4% and core 2.4%.
- Breadth. If services and core goods inflation are rising, the impulse has spread beyond the original shock, often through demand and wages.
- Labour market. Low unemployment and fast wage growth point to demand pressure and second-round risk.
- Output. Rising inflation with falling output or real income is the cost-push signature.
- Producer prices and the dollar. Rising PPI and a weaker currency signal cost pressure that has not yet reached consumers.
- Expectations. Survey and market measures of expected inflation show whether the public expects the shock to last.
How should a central bank respond to each type?
Against demand-pull inflation, raise rates; against cost-push inflation, look through a one-off shock but act if it starts to spread. Monetary policy works by restraining spending, so it hits demand-pull inflation at its source. A higher policy rate cannot produce more oil or ships. What it can do is stop a supply shock from turning into persistent inflation by anchoring expectations and cooling the labour market before a wage-price spiral starts.
The 2026 data show that this judgement is live. With energy prices rising sharply, the Federal Reserve raised its target range by 25 basis points to 3.75–4.00% on September 16, 2026. Whether that is a response to cost-push pressure, to sticky demand, or to the risk that one becomes the other is exactly the question the decomposition above tries to answer.
Governments have other tools against cost-push inflation: temporary tax cuts on fuel and energy, releases from strategic reserves, and investment in supply capacity. Their drawback is that subsidies and tax cuts can support demand and widen deficits, and prices jump when they expire.
What is a wage-price spiral, and can cost-push turn into demand-pull inflation?
A wage-price spiral is a feedback loop in which higher prices lead workers to demand higher wages, and firms pass those wages on in higher prices. It is the main channel through which a temporary cost shock becomes lasting inflation. Once the loop runs, inflation no longer needs the original shock; it feeds on itself and on expectations.
Robert J. Gordon formalised this in his “triangle” model of inflation, which explains inflation with three groups of variables: inertia, demand and supply shocks such as jumps in the price of oil. Textbooks often relabel them as built-in, demand-pull and cost-push inflation. The model explained why inflation and unemployment rose together in the 1970s, which a simple Phillips curve could not.
A related, contested idea is profit-led inflation, sometimes called “greedflation”: firms with pricing power raise margins under cover of a general cost shock. It is not a third type so much as a question about how much of a cost shock gets passed on, which, again, depends on how strong demand is.
Is cost-push inflation worse than demand-pull inflation?
For most households, yes. Demand-pull inflation usually comes with rising employment and wages, so many people keep up. Cost-push inflation combines rising prices with weaker growth, falling real incomes and harder policy choices. For investors, the difference shows up in asset behaviour: stocks often struggle in supply-shock inflation because profit margins and growth suffer together, while inflation-linked bonds such as US TIPS adjust principal for CPI regardless of the source. This is general education, not investment advice; if you are comparing asset types, our explainer on CFDs vs stocks vs ETFs covers the basics of each instrument.
What does this mean in practice?
“Is it demand or supply?” is the right question, but the honest answer is usually “supply lit the fire, demand decided how long it burned”. When you read an inflation report, check headline against core, look at the SF Fed decomposition, and watch wages and expectations. A shock that stays in energy and food tends to fade as prices stop rising; a shock that reaches services and wages is the one that forces central banks into recessions.
The economics behind price responses on individual markets, including why some prices barely react to demand changes, is covered in our guide to price elasticity of demand.
FAQ
What is the main difference between demand-pull and cost-push inflation?
Demand-pull inflation comes from spending growing faster than output and raises prices together with output and employment. Cost-push inflation comes from higher production costs and raises prices while output falls. On an AD-AS diagram, demand-pull shifts AD right and cost-push shifts SRAS left.
What are examples of cost-push inflation?
The 1973-74 and 1979 oil shocks, when crude prices quadrupled and then tripled, the 2022 European energy crisis, supply-chain shortages in 2021-22, harvest failures, currency collapses in import-dependent economies, and tariffs on imported goods.
What are examples of demand-pull inflation?
Spending booms that outrun capacity: late-1960s US war and social spending with loose monetary policy, credit and housing booms, and large fiscal transfers into an economy already near full employment.
Was the 2021-2023 inflation caused by demand or supply?
Both. The SF Fed’s decomposition attributed about half of the April 2022 run-up to supply factors and about a third to demand. Bernanke and Blanchard found that price shocks drove most of the surge, while a later SF Fed letter by Lansing concluded demand was the primary driver.
Why do interest rate hikes work better against demand-pull inflation?
Rate hikes work by reducing spending, which is the cause of demand-pull inflation. They cannot lower oil or input costs, so against cost-push inflation their main role is preventing second-round effects and anchoring expectations, at the cost of weaker growth.
What is stagflation?
Stagflation is high inflation combined with stagnant growth and rising unemployment. It is the typical outcome of a large cost-push shock, as in the US in the 1970s, when CPI inflation peaked at 14.8% in March 1980.
What is built-in inflation?
Built-in inflation is inflation that persists because past inflation is embedded in wages, contracts and expectations. In Robert Gordon’s triangle model it is the inertia component, alongside demand and supply shocks.
Sources and further reading
- Shapiro, A. H. — How Much Do Supply and Demand Drive Inflation? FRBSF Economic Letter 2022-15
- Federal Reserve Bank of San Francisco — Supply- and Demand-Driven PCE Inflation (data, updated September 30, 2026)
- Lansing, K. — Is Demand or Supply More Important for Inflation? FRBSF Economic Letter 2025-14
- Bernanke, B. and Blanchard, O. — What Caused the U.S. Pandemic-Era Inflation? NBER WP 31417 (2023)
- Gordon, R. J. — Friedman and Phelps on the Phillips Curve Viewed from a Half Century’s Perspective, NBER WP 24891 (2018)
- Federal Reserve History — The Great Inflation
- Federal Reserve History — Oil Shock of 1978–79
- BLS — The Economics Daily: CPI history including the March 1980 peak
- BLS — Consumer Price Index, August 2026
- Federal Reserve — FOMC statement, September 16, 2026
- IMF Finance & Development — Inflation: Prices on the Rise
- European Central Bank — Why is inflation currently so high?
- Narodowy Bank Polski — Inflation Report, July 2022 (Polish)